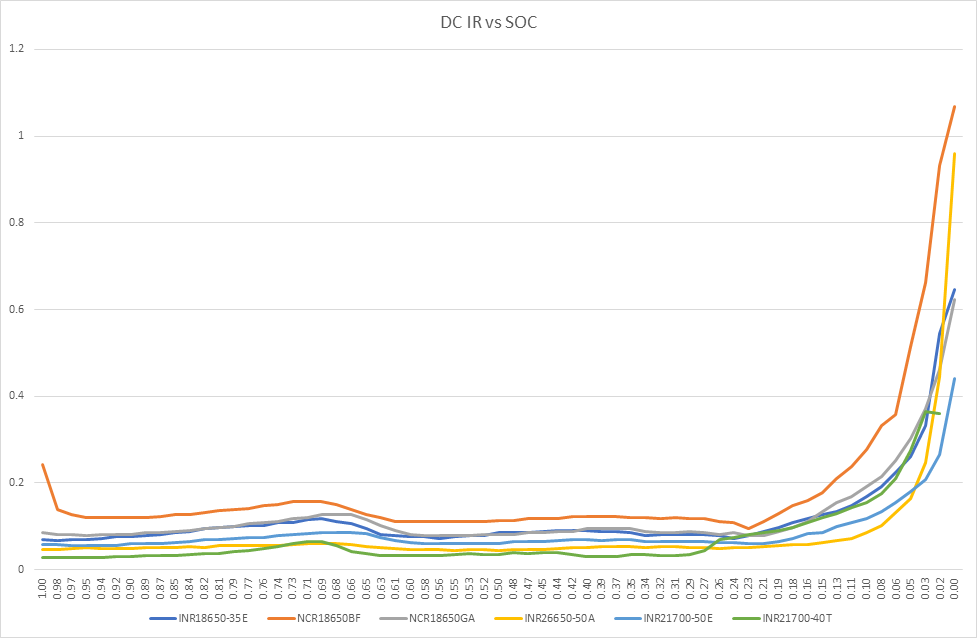
DC IR vs SOC (IV)
Further to the data on internal resistance I have been collecting while modelling cells.
I have measured slight increases in DC IR when cells have reached 90% of their original capacity, I can give that data if interested. It is useful to see how a cell reacts when it has been cycled and has aged a bit, an essential aspect for power applications.
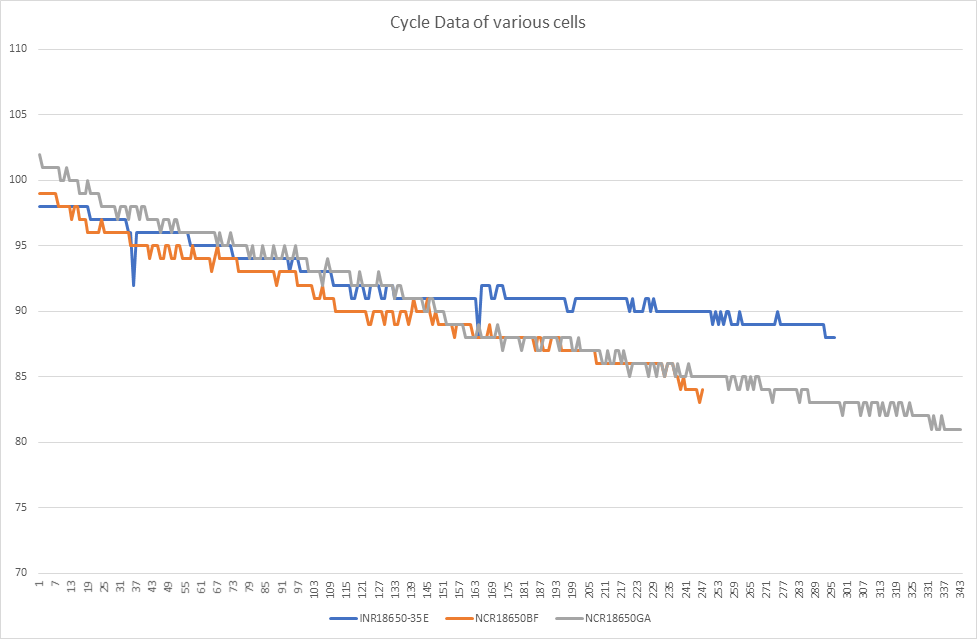
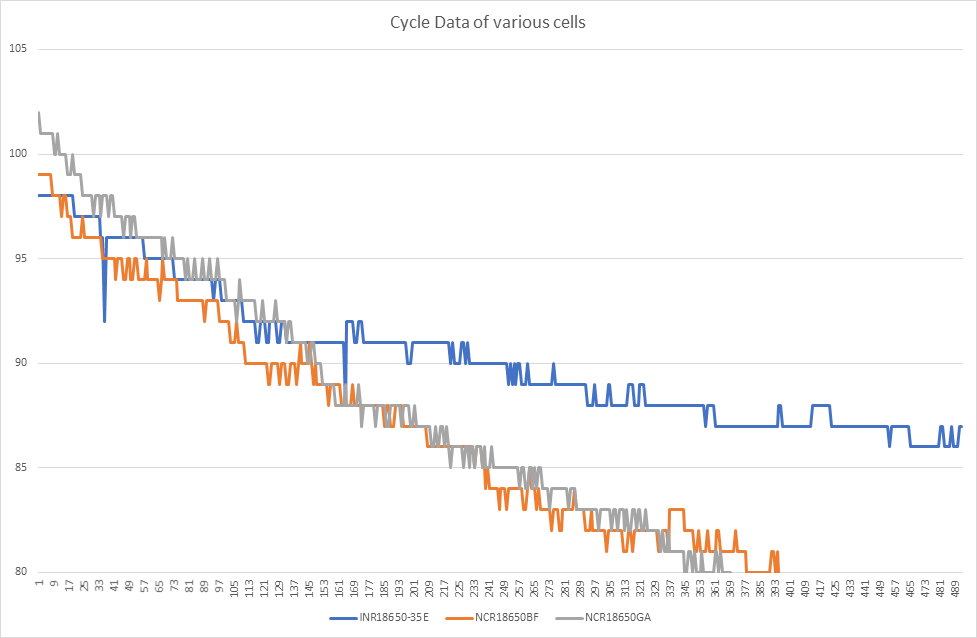
To get the IR data at 90% ( and later 80%) I have been cycling cells in my bunker on a Cadex C7400.
NCR18650BF. Charge at 0.5C. Discharge at 0.5C
NCR18650GA. Charge at 0.5C. Discharge at 1C
INR18560-35E. Charge at 0.5C. Discharge at 1C
The NCR18650GA has almost reached 80% at 343 cycles.
The INR18650-35E from Samsung seems to be doing better.
This is a test of just one cell, cell to cell variability is unknown.