
DC IR vs SOC
I’ve been playing and making graphs. Below are several model cells of similar capacity that I have done open-circuit voltage (OCV) discharge curves on.
In brief, the method was to charge the cell as per the manufacturer recommendations. Then I discharged at 0.1C for 10 minutes and took a voltage reading before the current switched off. A 10 minute rest followed before taking the OCV. This was continued until the cell reached the recommended cut off voltage of the cell.
The difference of the cell under load and OCV was used to calculate the internal resistance.
The x axis is the state of charge of the cell, the y is the resistance in ohms. Interesting to note the increase in resistance around the 70% mark. This should correspond with a voltage dip in discharge curves when discharging at higher currents but often you do not see them as the cell is warmer and IR is lower as a cell warms up. The OCV discharge curve vs SOC is shown below in figure 2, no dip due to low discharge current.
The IR increases at about 15% SOC which is where the OCV begins to dip.
More to come when these cells are at 90% of their original capacity. The IR will increase, by how much is important when recommending a cell for a power application and suggesting a battery service life and warranty period.
This data can be used when it comes time to choosing a cell for an application.

Figure 1.
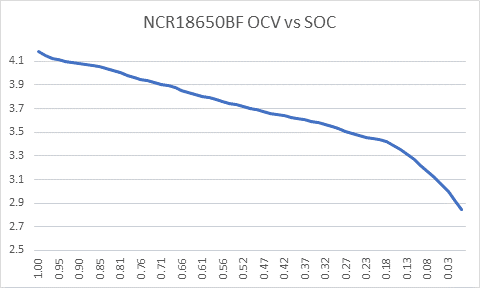
Figure 2.


