DC IR vs SOC (II)
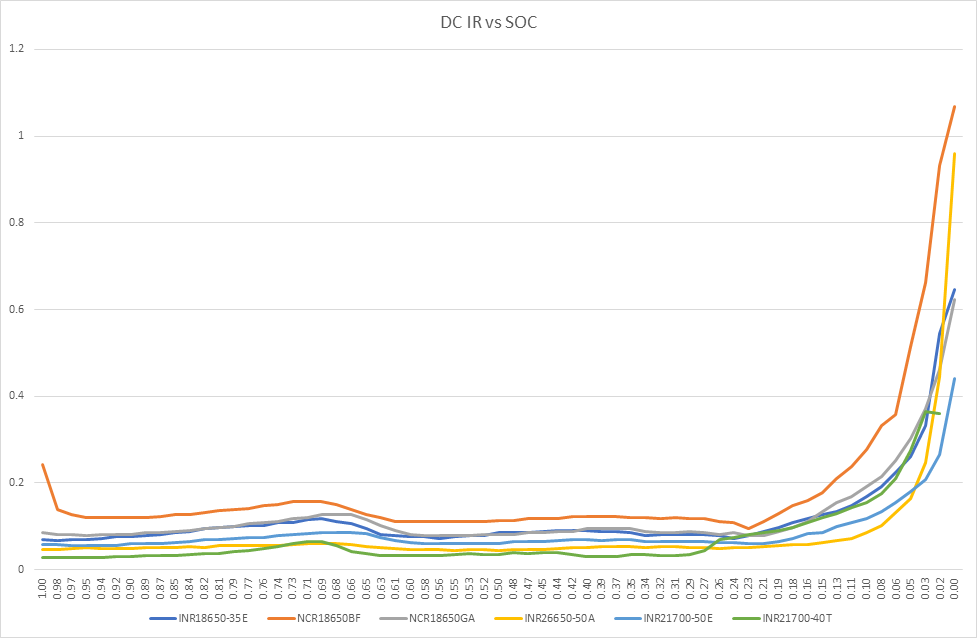
Continuing on with internal resistance testing of cells, I have added the INR21700-50E data to the graph. This cell is rated at 4900mAh and as seen on the graph, quite low internal resistance making it ideal for power applications. According to the manufacturer this cell was design for EV use and has a very high cycle life. We’ll take a closer look at this cell in the future.

Also, below is the VOC graph for each cell. These differ from usual discharge curve graphs as they show the unloaded voltage of the cells versus SOC. Considering how different the INR26650-50A is I will do this one again to be sure the test worked correctly.

The chemistries above are all Lithium Nickel Manganese Cobalt Oxide (LiNiMnCoO2) — NMC and exhibit quite a different voltage curve compared to Lithium Iron Phosphate(LiFePO4) — LFP. The LFP discharge curve is quite flat, especially between about 90% SOC and 10% SOC. I will add some LFP test data in the future, I only have so much equipment I can dedicate to testing cells so these tests might come in 2021.